[Avg. reading time: 9 minutes]
Terms to Know
Regression
Predicting a continuous numeric value.
Use Case: Predicting house prices based on size, location, and number of rooms.
Linear Regression
A regression model assuming a straight-line relationship between input features and target.
Use Case: Estimating sales revenue as a function of advertising spend.
Classification
Predicting discrete categories.
Use Case: Classifying an email as spam or not spam.
Clustering
Grouping similar data points without labels.
Use Case: Segmenting unknown data into groups.
Feature Engineering
Creating new meaningful features from raw data to improve model performance.
Use Case: From “Date of Birth” → create “Age” as a feature for predicting insurance risk.
Overfitting
Model learns training data too well (including noise) -> poor generalization.
Use Case: Overfitting = a spam filter that memorizes training emails but fails on new ones.
Underfitting
Model too simple to capture patterns -> poor performance.
Use Case: Trying to predict house prices using only the average price (ignoring size, location, rooms, etc.).
Bias
A source of error that happens due to overly simplistic assumptions.
- Leads to underfitting.
Variance
A source of error that happens due to too much sensitivity to training data fluctuations.
- Leads to overfitting.
Model Drift
When a model’s performance degrades over time because data distribution changes.
Use Case: A churn model trained pre-pandemic performs poorly after online behavior changes drastically.
MSE
Mean Squared Error
Avg of the squared differences between predicted values and actual values.
Actual a: [10, 20, 30, 40, 50]
Predicted p : [12, 18, 25, 45, 60]

| i | Actual| Predicted | Error | Squared Error |
| - | ------|-----------|-------|---------------|
| 1 | 10    | 12        |  -2   | 4             |
| 2 | 20    | 18        |   2   | 4             |
| 3 | 30    | 25        |   5   | 25            |
| 4 | 40    | 45        |  -5   | 25            |
| 5 | 50    | 60        | -10   | 100           |

SS = 4 + 4 + 25 + 25 + 100 = 158

MSE (ss_res) = 158 / 5 = 31.6
R Square
Proportion of variane in the target explained by the model.
1.0 = Perfect Prediction. 0.0 = Model is no better than predicting the mean. Negative = Model is worse than just predicting the mean.
Mean of actual values = (10 + 20 + 30 + 40 + 50) / 5 = 30

Total Variation (ss_tot) : (10 - 30)^2 + (30 - 30)^2 + (40 - 30)^2 + (50 - 30)^2 = 400 + 100 + 0 + 100 + 400 = 1000

R^2 = 1 - (ss_res / ss_tot)

R^2 = 1 - (158/1000) = 0.842
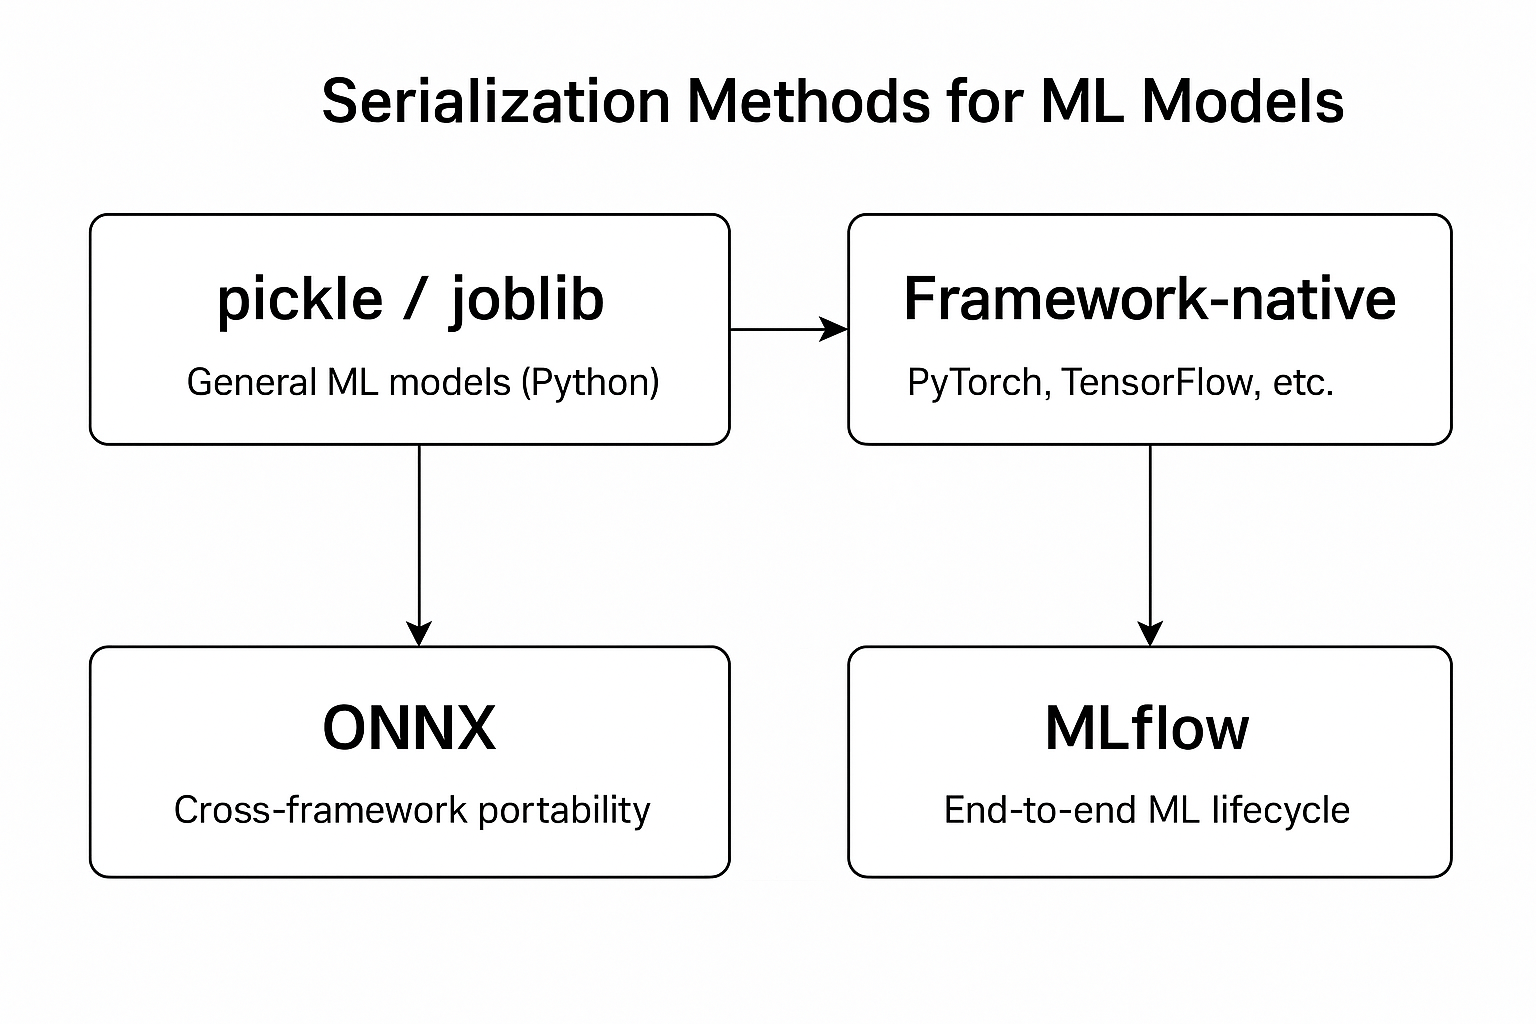
Serialization
The process of converting an in-memory object (e.g., a Python object) into a storable or transferable format (such as JSON, binary, or a file) so it can be saved or shared.
import json

data = {"name": "Ganesh", "course": "MLOps"}
# Serialization → Python dict → JSON string
serialized = json.dumps(data)

## Store the serialized data into JSON file if needed.
Deserialization
The process of converting the stored or transferred data (JSON, binary, file, etc.) back into an in-memory object that your program can use.
# Load it from JSON file
# Deserialization → JSON string → Python dict

deserialized = json.loads(serialized)