[Avg. reading time: 11 minutes]
Data Imputation
Data Imputation is the process of filling in missing values in a dataset with estimated or predicted values.
Data imputation aims to enhance the quality and completeness of the dataset, ultimately improving the performance and reliability of the ML model.
Problems with Missing Data
- Reduced Model
- Biased Inferences
- Imbalanced Representations
- Increased complexity in Model handling
Data Domain knowledge is important before choosing the right method.
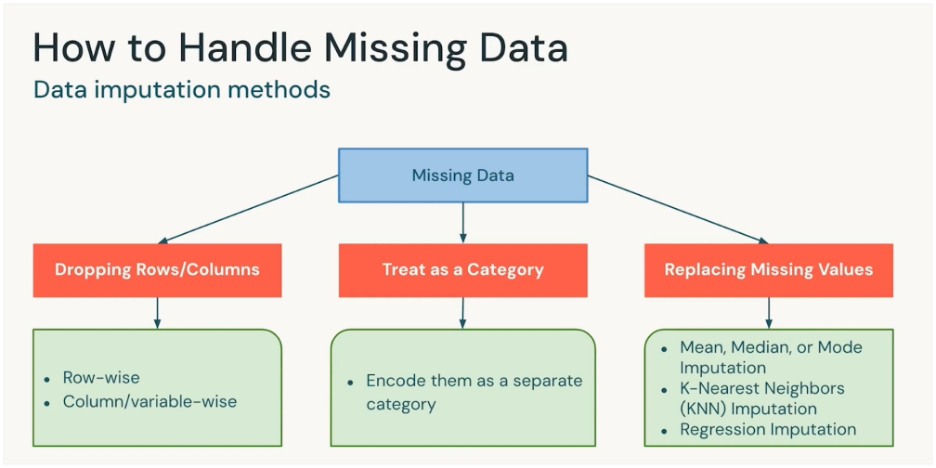
Dropping Rows/Columns
Remove the rows or columns that contain missing values.
- If the percentage of missing data is very small.
- If the column isn’t important for the model.
Example: Drop the few rows out of Million where “Age” is missing.
Treat as a Category
Encode “missing” or “NA” or “Unknown” as its own category.
- For categorical variables (like Country, Gender, Payment Method).
When “missing” itself carries meaning (e.g., customer didn’t provide income → may be sensitive).
Example: Add a category Unknown to “Marital Status” column.
Data with Missing Values
| ID | Country |
|---|---|
| 1 | USA |
| 2 | Canada |
| 3 | Null |
| 4 | India |
| 5 | NA (missing) |
After treating as a Category
| ID | Country |
|---|---|
| 1 | USA |
| 2 | Canada |
| 3 | Missing |
| 4 | India |
| 5 | Missing |
The model will see “Missing” as just another value like “USA” or “India.”
Replacing Missing Values (Imputation)
Fill missing values with a reasonable estimate.
Methods:
- Mean/Median/Mode: Quick fixes for numeric/categorical data.
- KNN Imputation: Fill value based on “closest” similar records.
- Regression Imputation: Predict the missing value using other features.
Example: Replace missing “Salary” with median salary of the group.
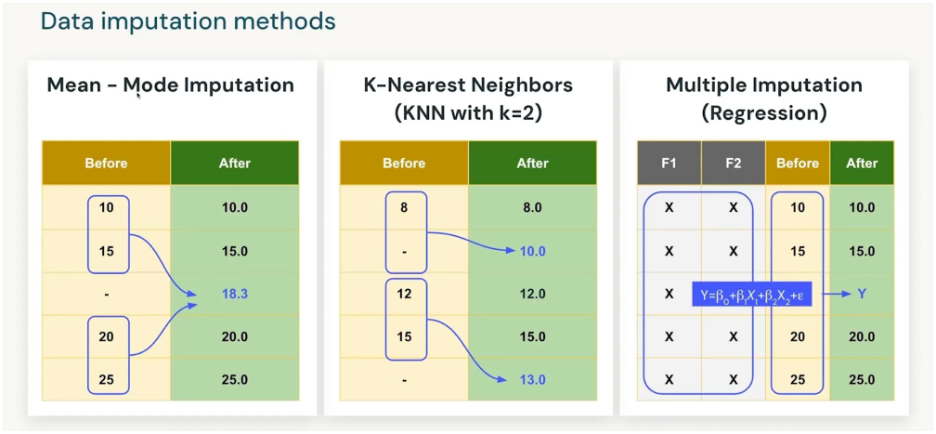
Using regression models repeatedly (with randomness) to fill missing data, producing several plausible datasets, and then combining them for analysis.
| Age | Education | Income |
|---|---|---|
| 30 | Masters | ? |
| 40 | PhD | 120K |
| 35 | Bachelors | 80K |
- Step 1: Fit regression: Income ~ Age + Education.
- Step 2: Predict missing Income for Age=30, Edu=Masters.
- Step 3: Add random noise → 95K in dataset1, 92K in dataset2, 98K in dataset3.
- Step 4: Analyze all 3 datasets, combine results.
Downside: Delay in process and computing time. More missing values more coputation time.
- Drop : if it’s tiny and negligible.
- Category : if it’s categorical.
- Replace : if it’s numeric and important.
- KNN/Regression : if you want smarter imputations and can afford compute.
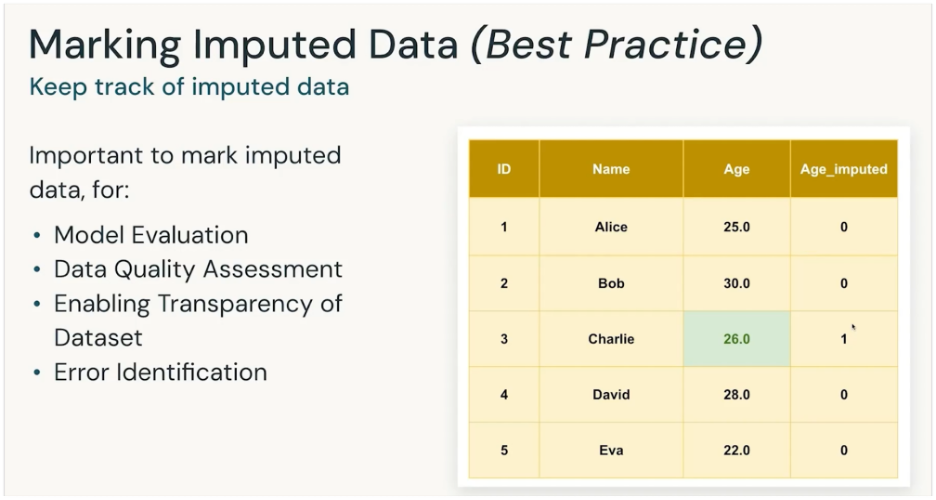
It is important to mark the imputated data
To know which data is from source and which is calculated. So its handled with pinch of salt.
| Method | When to Use | Pros | Cons |
|---|---|---|---|
| Drop Rows/Columns | When % of missing data is very small (e.g., <5%) or the feature is unimportant | - Simple and fast - No assumptions needed | - Lose data (rows) - Risk of losing valuable features (columns) |
| Treat as a Category | For categorical variables where “missing” may carry meaning | - Preserves all rows - Captures the “missingness” as useful info | - Only works for categorical data - Can create an artificial category if missing isn’t meaningful |
| Replace with Mean/Median/Mode | For numeric data (mean/median) or categorical (mode) | - Easy to implement - Keeps dataset size intact | - Distorts distribution - Ignores correlations between features |
| KNN Imputation | When dataset is not too large and similar neighbors make sense | - Considers relationships between features - More accurate than simple averages | - Computationally expensive - Sensitive to scaling and choice of K |
| Regression Imputation | When missing values can be predicted from other variables | - Uses feature relationships - Can be very accurate | - Risk of “overfitting” imputations - Adds complexity |